proto-observer simulation
This text presents an approximation of how it might be possible today to get a glimpse of something that would echo the beginning of interaction of the first living molecules (proto-observers) with their immediate environment. It resulted in their ability to distinguish “hot” from “cold”, “light” from “dark”, and has been recorded and passed to all living matter.
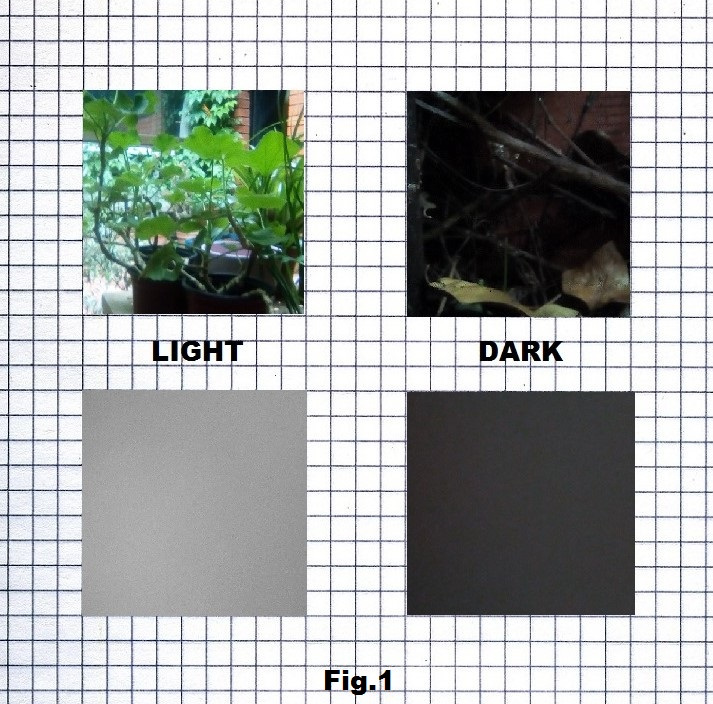
In order to preserve their structural integrity, to survive, earliest life form (living molecule) had to acquire “information” about the properties of their immediate surroundings. It seems reasonable to assume that those vital properties had been what we call “hot” and “cold”, which at that point were most likely the same as “light” and “dark”.
However, in order to be able to distinguish the properties of its surroundings, this “knowledge” had to be at some point distinguished for the first time, and then encoded/impressed into these molecules as an integral part of their structure, as some kind of “memory”. Those earliest living molecules, proto-observers, which by some chain of events acquired this capacity to sense/recognize “hot” and “cold” and preserve it, had a much better chance of survival. Thus, the very basic properties of our environment that we could distinguish today as hot–cold, dark–light, order–disorder, were most likely first acquired by the earliest living molecules (proto-RNA?), then encoded and memorized within their molecular structure and then transmitted to all living matter including us.
These “first images” are in fact the most rudimentary “pictures of the world” impressed (recorded) by early life forms, and it is not possible to experience them. However, the capacity to distinguish hot (bright) or cold (dark) is characteristic of all life forms today and it is still necessary for their survival. Thus, it is most likely that this earliest “picture of the world” was binary: hot–cold (white–black).
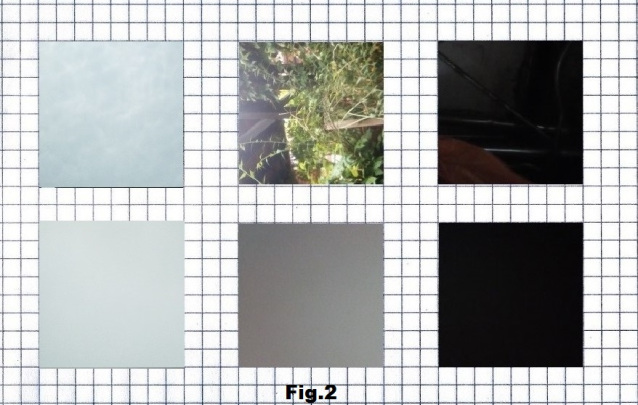
Then, at some point a third option was added, one that is somewhere in between: warm (gray). Probably much later, as the next step, two more shades (light and dark) were added to increase complexity of the images generated this way. This is why we could think of a DNA/RNA strand, not exactly as film, but as a series of pixels, each with one of four shades of gray, containing encoded images impressed on them, which had to be deciphered in some way. One possibility would be an algorithm that interprets bases as shades of gray and converts these linear strands into 3×4 matrices thus becoming 2D pictures. [fig. 4]
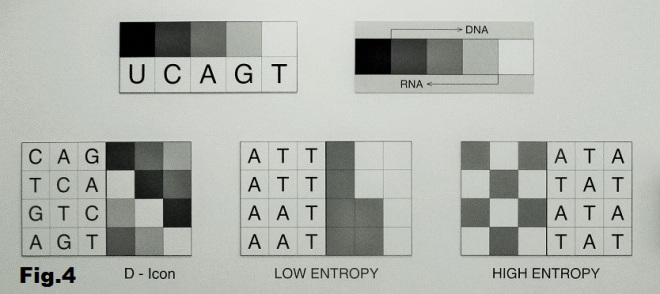
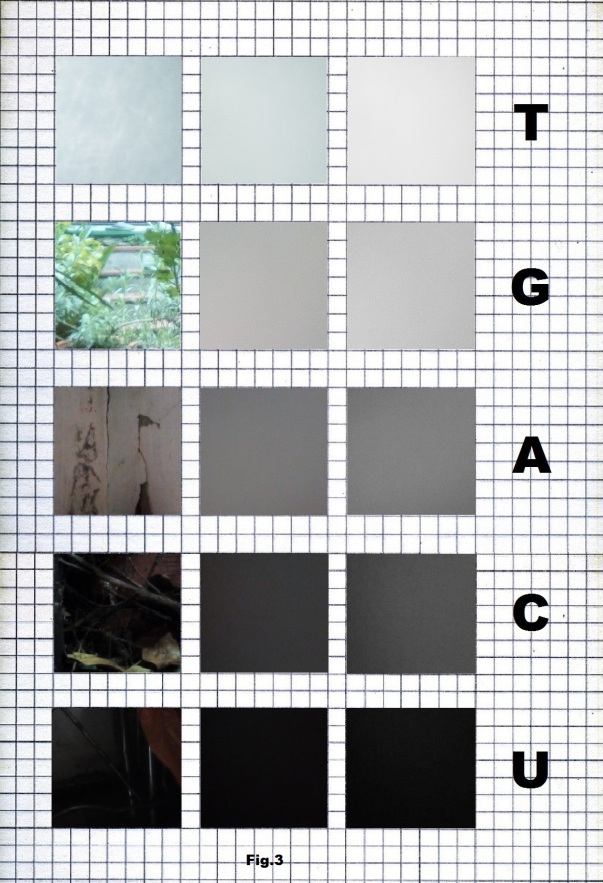
These images are not only the results of the algorithm that represents DNA/RNA visually, but they themselves could be interpreted as an echo of these primal rudimentary pictures of the world. They might be even imitated with some kind of crude “camera” (light sensor) that would pick-up only the intensity of light around it, identify it as one of five shades of gray, record it and arrange it in a linear form and after 12 such recordings convert this linear sequence into 3×4 matrix forming a 2D image as it is explained in the footnote below. [ 1 ] 1. These are some thoughts about making a rudimentary “camera” or rather a sensor which will be able to pick-up and store light of a certain value/intensity. While moving this sensor between bright (sunny) and shadowy areas the intensity of recorded light would change from light to dark. Also, there has to be a timer, let’s say 1 sec (or 5 sec, 10 sec) that would end one recording instance and begin another. In our case it should be able to record one of five discrete values of the gray-scale at a time: white (0% black), light-gray (25% black), gray (50%) dark-gray (75%) and black (100%). However, since the intensity of light around us doesn’t have only these five discrete values but it is rather a of light values we have to decide which amounts will fill these five values. One possibility would be to define an interval as a single value. For example, if gray is defined as 50% black (between light-gray and dark-gray) then we will add 12.5% on both sides of this value and get an interval 37.5% – 62.5% that a sensor would pick up and categorize as “gray”. Similarly, amounts of light between 12.5% – 37% would be recorded as “light-gray” and the 62.5% – 87.5% interval would be “dark-gray”. And the interval from 12.5% to any higher intensity of light will be recorded as “white” while from 87.5% to any detected darker value will be recorded as “black”. These are “pragmatic” definitions of these five values of the gray-scale. Since, both DNA and RNA consist of four bases/values each, we have to decide how to define the border values in each these cases. In DNA the darker end is dark-gray, and the question is if we will keep its definition or extend its value to “black”. And in case of RNA it is the “light-gray” that is on the brighter end of the scale and the question is if it should stay as defined above or to be extended and include “white” as well. All this becomes more complicated considering first that DNA has two strands that reflect each other in a specific way. If a “positive” DNA sequence is TGAC (white, light-gray, gray, dark-gray) then its “negative would be ACTG (gray, dark-gray, white, light-gray) and this is called “replication”. Now, when the “messenger RNA” arrives to make a copy from a DNA sequence, the double-helix opens and the RNA makes a copy from the “negative” side of the strand ACTG that would be UGAC. Now, if we compare this RNA sequence with the “positive” side of the DNA, we would notice that they are the same except that instead of T (white) in DNA we have U (black) in RNA. Thus in this kind of two-step copying, from positive DNA strand to messenger RNA everything stays the same except that “white” is transformed into its negative – “black”, that is in itself quite interesting. It seems all this needs to be considered when deciding the border values in the four-value recordings, what would be the dark-gray in a series that corresponds to DNA and what would be light-gray in case of RNA; whether to remain as defined, or to be extended to “black” (and “white”). If we keep them as defined, we would in the case of DNA exclude recordings that come up as “black” and in the RNA case we would exclude “white”. Perhaps a sensor should have only one mode of operation, let’s say DNA as a positive strand, and store the recorded “pixels” (small squares) in a linear form. Thеn in the second step, convert this into a 2D image (3x4 “pixels”). From this recording we could get a negative DNA strand by using replication algorithm, and then the RNA as well. Starting with one set of four values, the other would be defined through DNA–DNA replication and DNA–RNA transcription. G (light-gray) and C (dark-gray) is the only base-pair with 50% value difference, and they also visually relate to each other as positive-negative. T and U also relate to each other as positive-negative but with a 100% value difference they do not form the base pair (value difference in all base pairs is 50%). In the case of two other base-pairs T–A and A–U bases do not relate to each other as positive-negative.
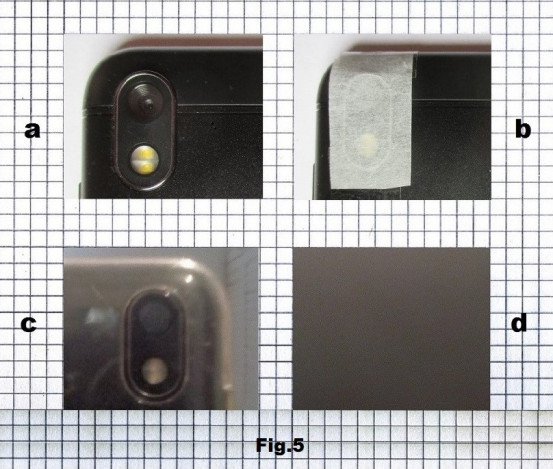
It is possible to simulate this process in a simplified way using a phone camera and covering it with semi-transparent paper, as shown on pictures 5a and 5b taken by another camera, while 4c and 4d are taken by the phone camera itself, first with and then without the cover [fig. 5c and 5d], the way it will be used in further recordings presented below. While in the “selfie” 5c we could recognize the camera, in 5d it is just a shade of gray, that could be almost anything including one of the shades representing the RNA/DNA bases, in this case C.
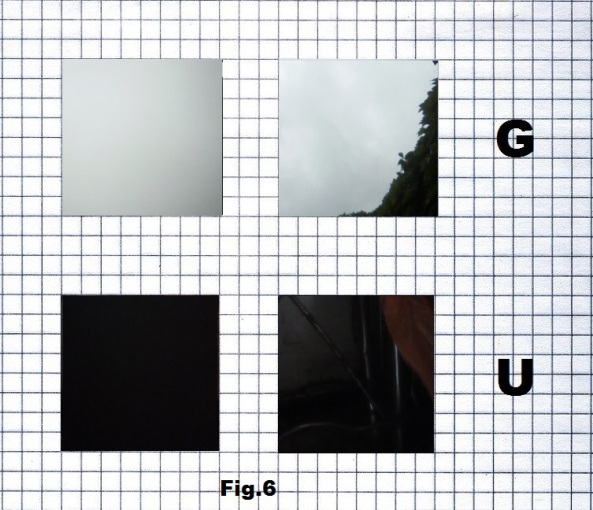
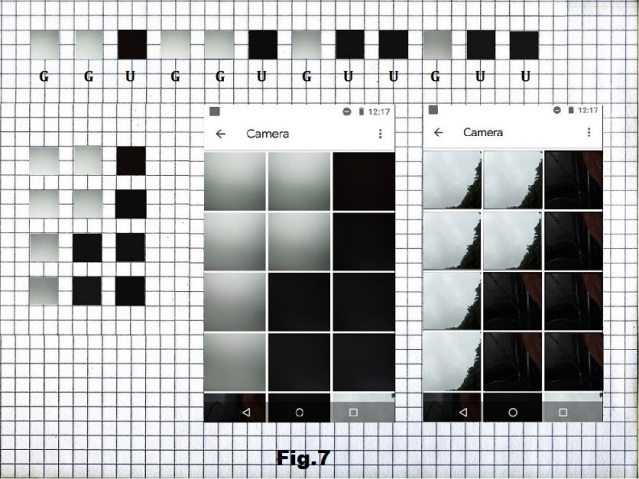
This approach was first tried with a series of pictures of a cloudy sky and a dark closet corner, without and with the cover [fig. 6], in such order that would, as a sequence of 12 “pixels” placed in a 3×4 matrix, constitute one of highly organized state that in the RNA interpretation consists of 6G and 6U. [fig. 7]
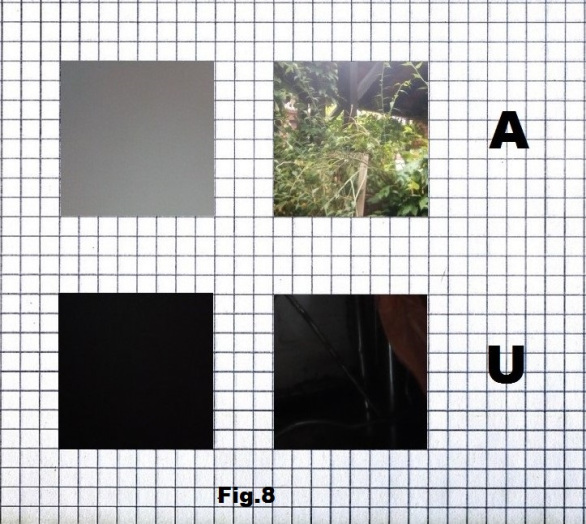
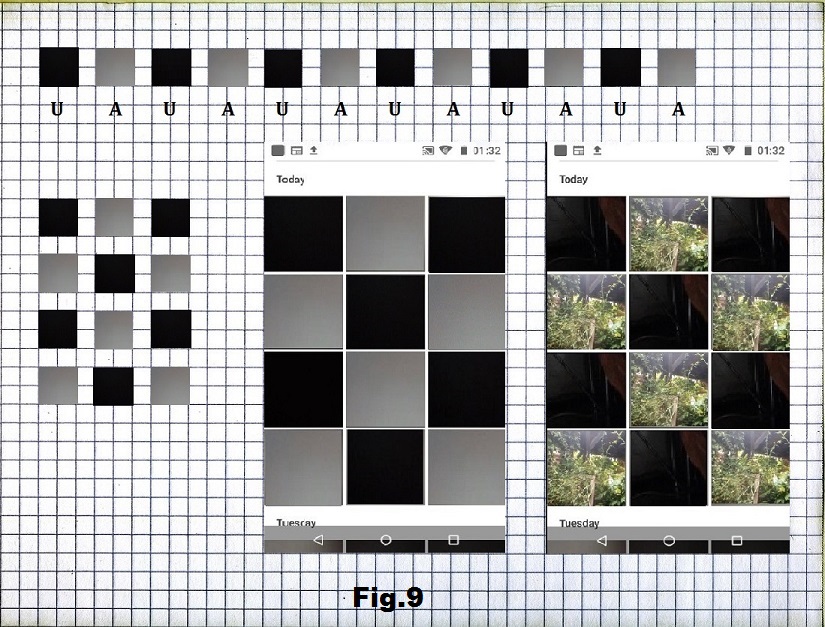
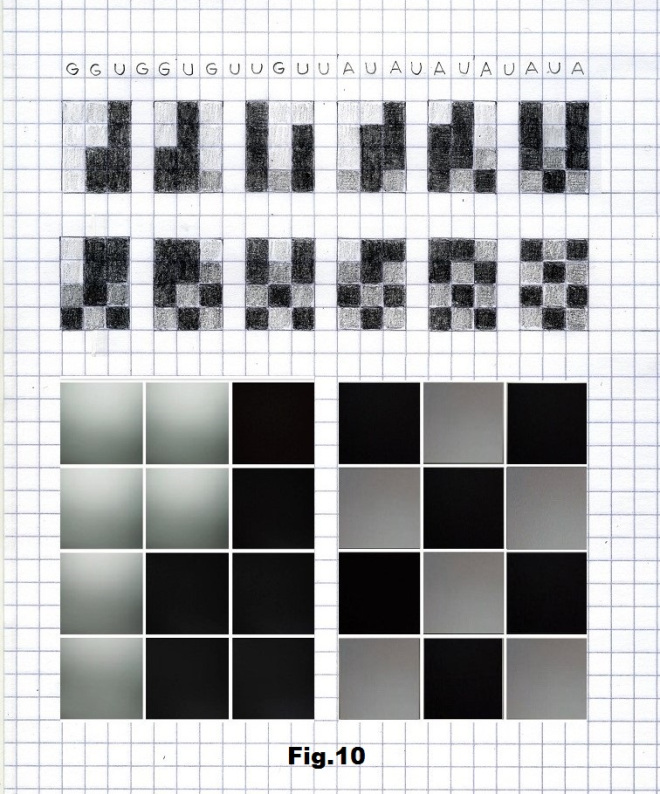
The next example is also a binary series based on a medium light image (gray) and very dark (black) [fig. 8] organized into 12 positions consisting of 6A and 6U that would form a 3×4 matrix with the highest state of entropy [fig. 9]. On fig. 10 is a longer sequence that would connect these two states by making a gradual transition from the lowest to the highest entropy state.
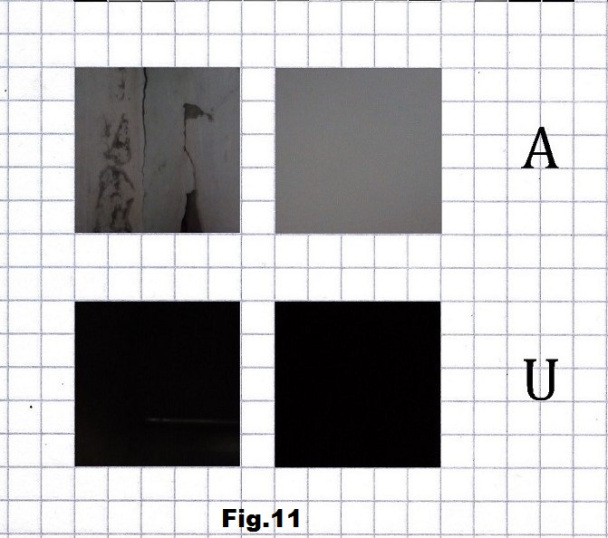
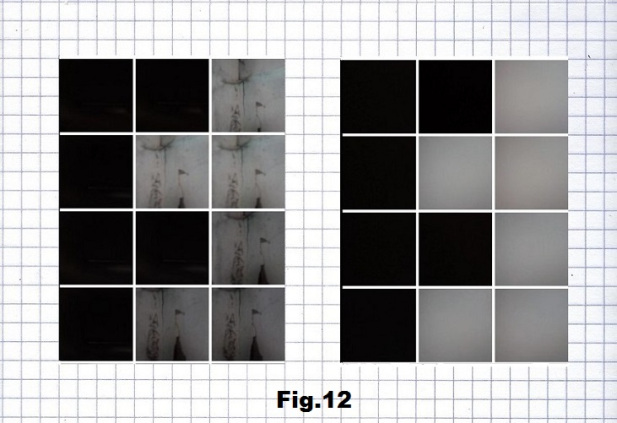
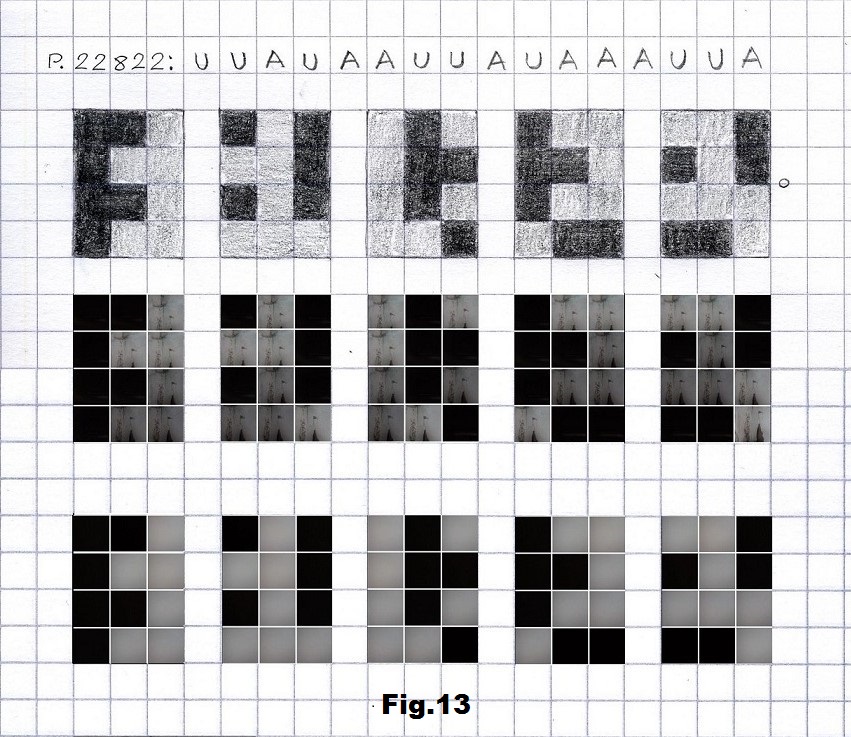
The next step was to implement this approach on some concrete strands like the recent visualization of certain SARS-CoV-2 sequences presented here in their RNA form. Here are four short sequences, first three beginning with the lowest states of entropy and the last one with the highest entropy. The first stretch (p.22822) is based on pictures without and with the camera cover of gray and very dark (black) corners of an interior space, representing here A and U. [fig. 11, 12 and 13]
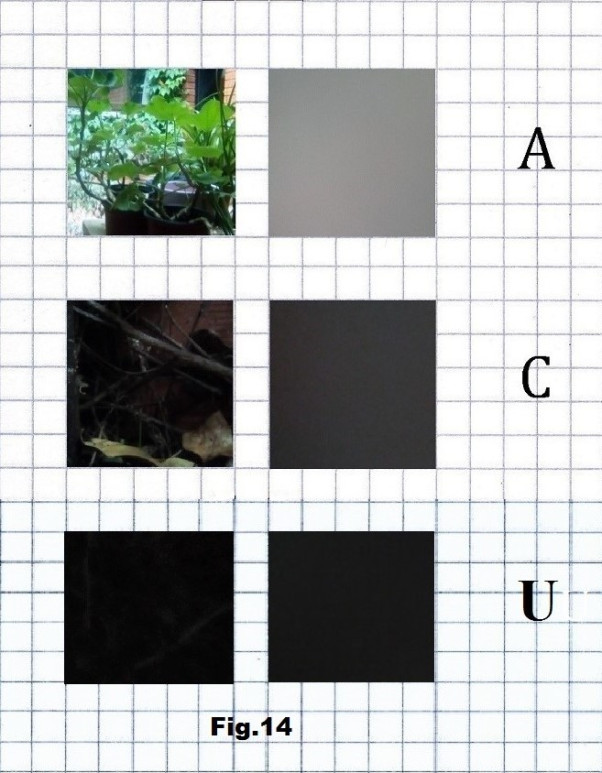
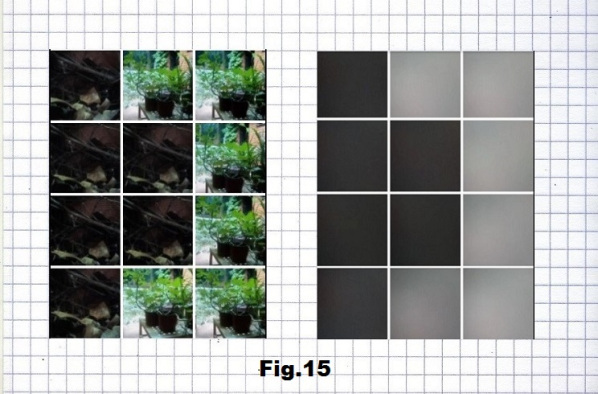
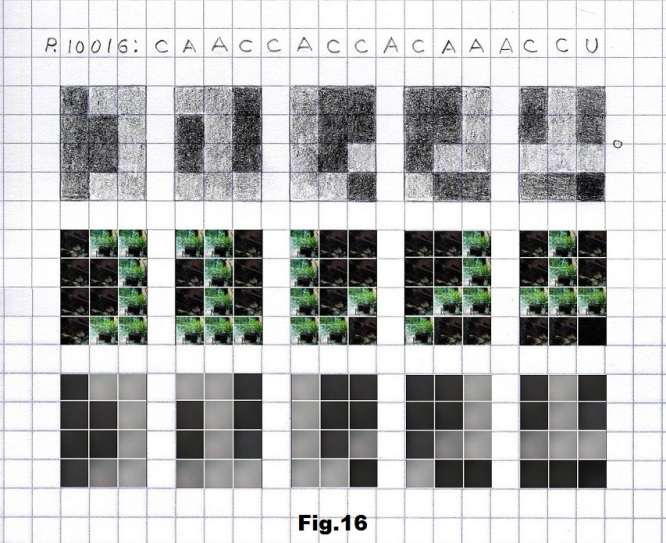
The next example is a binary sequence of 16 positions starting with another low entropy state (p.10016) consisting of 8C (dark), 7A (gray) and one U (black) base. Pictures corresponding to these bases are taken outdoors, one in a bright and another two in dark spots, again with and without a camera cover, as shown in fig. 14, 15 and 16.
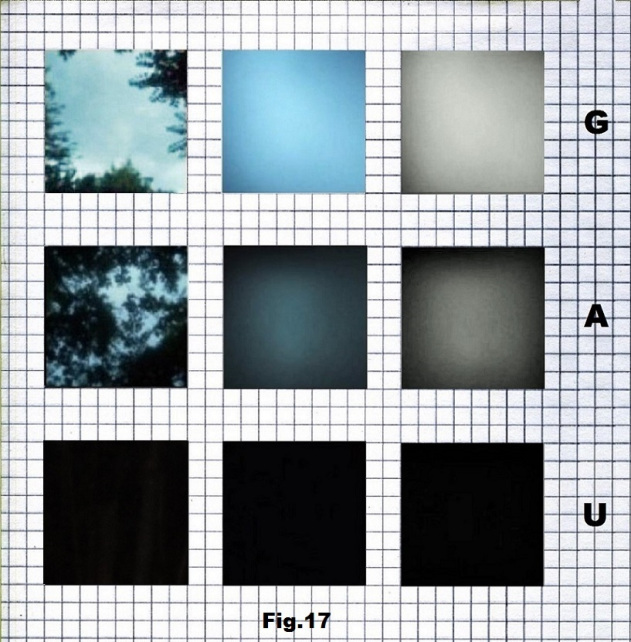
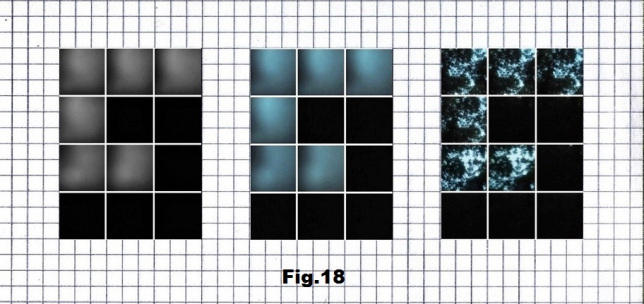
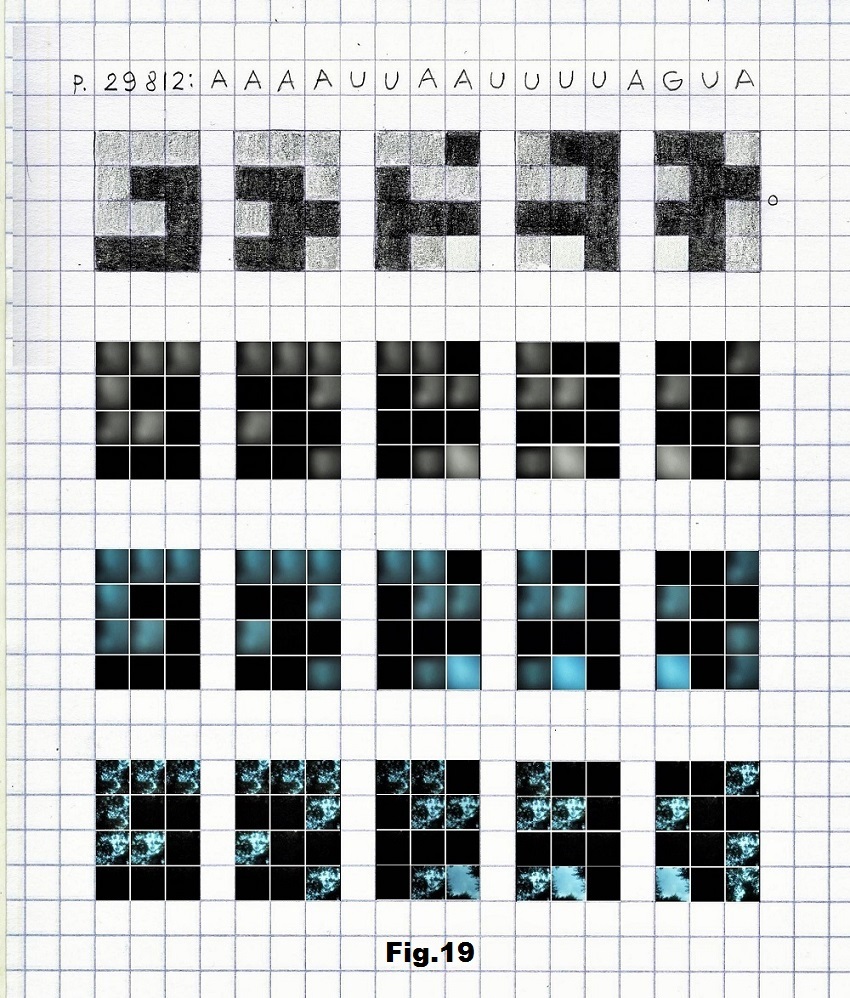
Pictures for the third case (p.29812) that begins with a low entropy state were taken in a forest, with the intensity of light that corresponds to the values representing G (light), A (gray) and U (black) as shown below in fig. 17, 18 and 19.
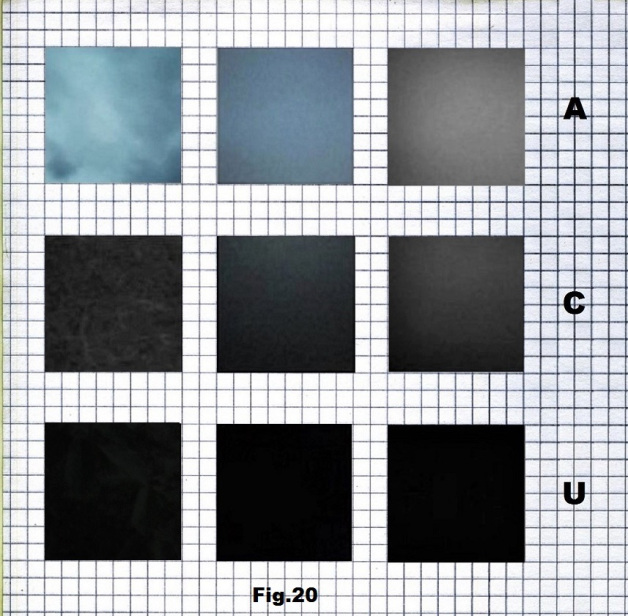
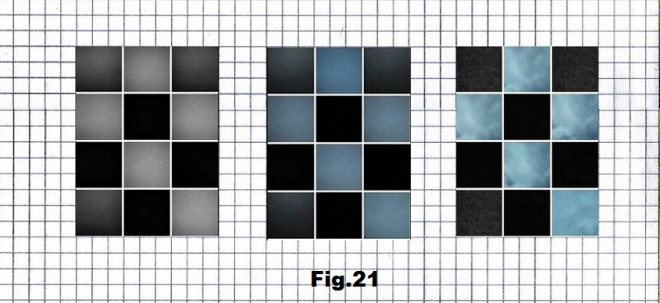
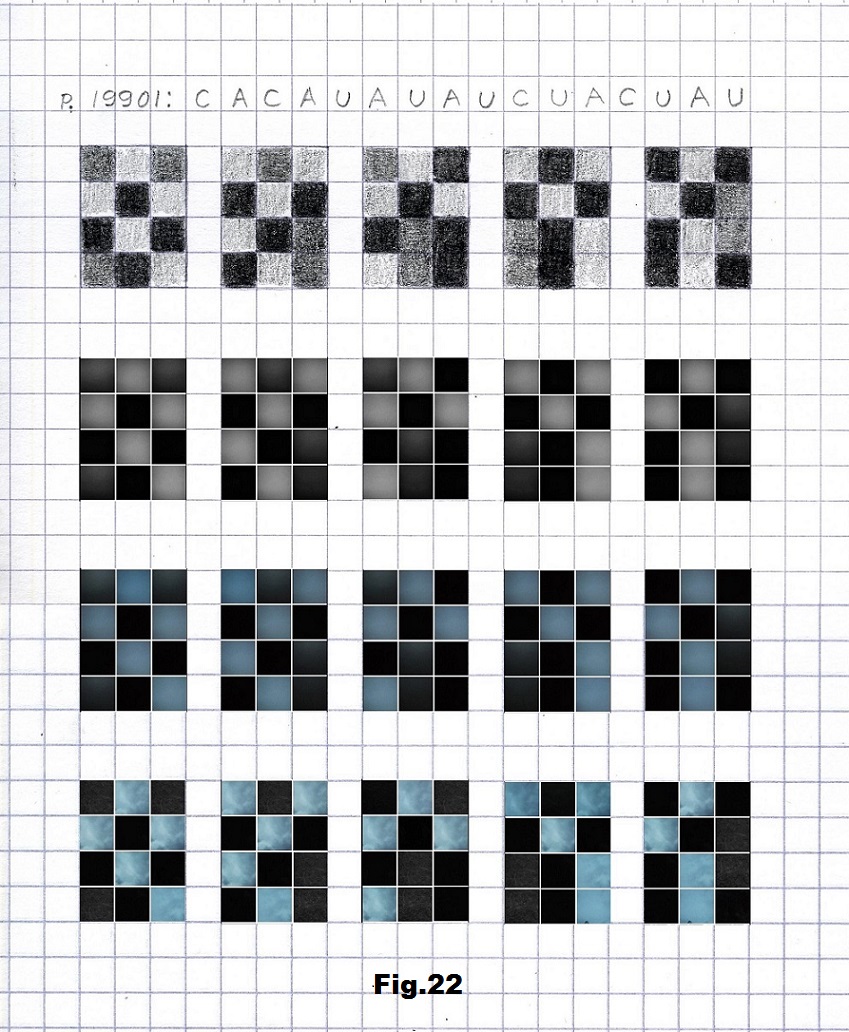
The last example is the only selected sequence (p.19901) that starts with the high entropy state (no element having the same value neighbor) represented by the pictures taken in a meadow after sunset consisting of three values representing bases A, C and U. [fig. 20, 21 and 22]
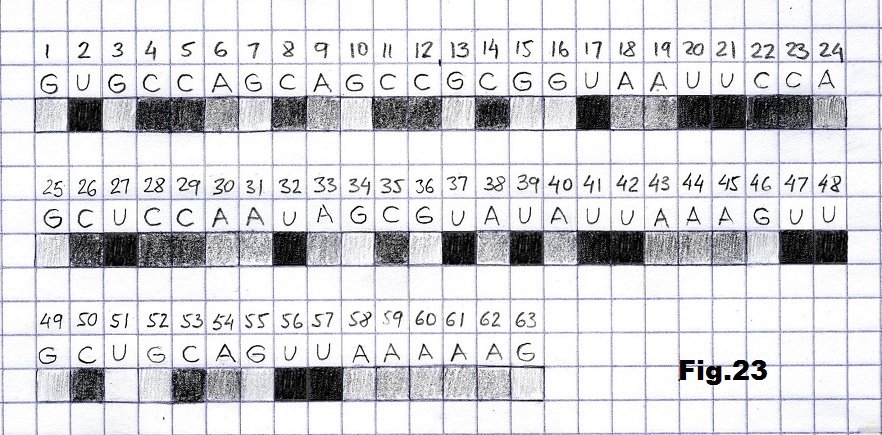
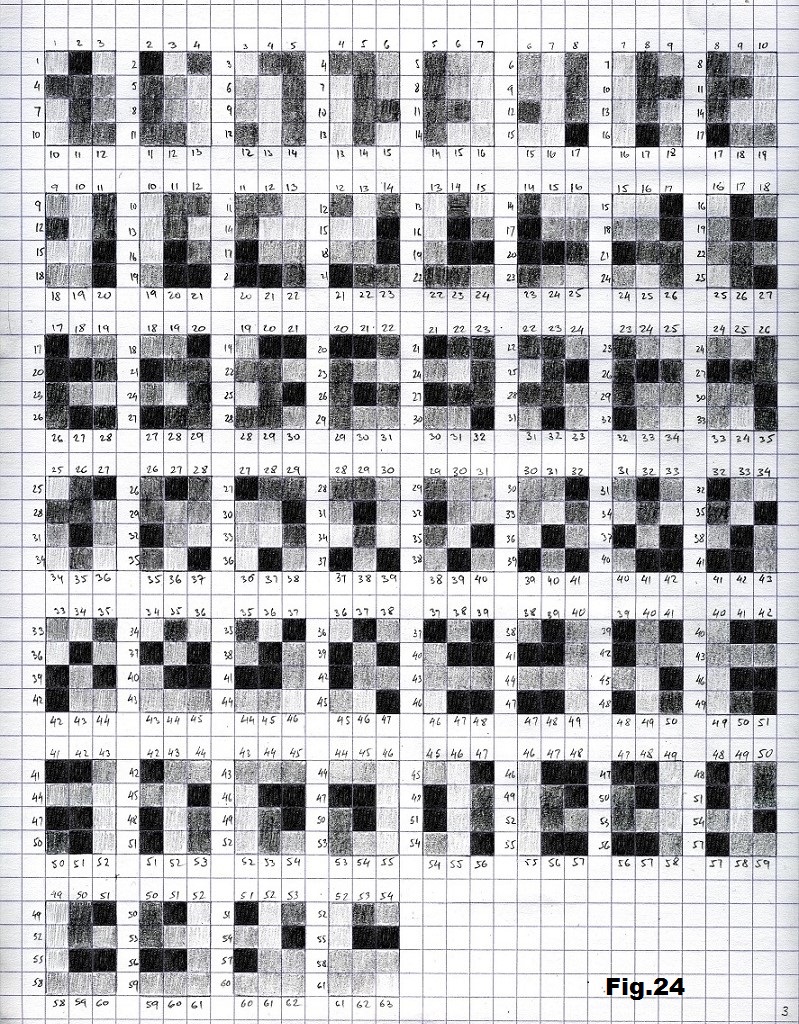
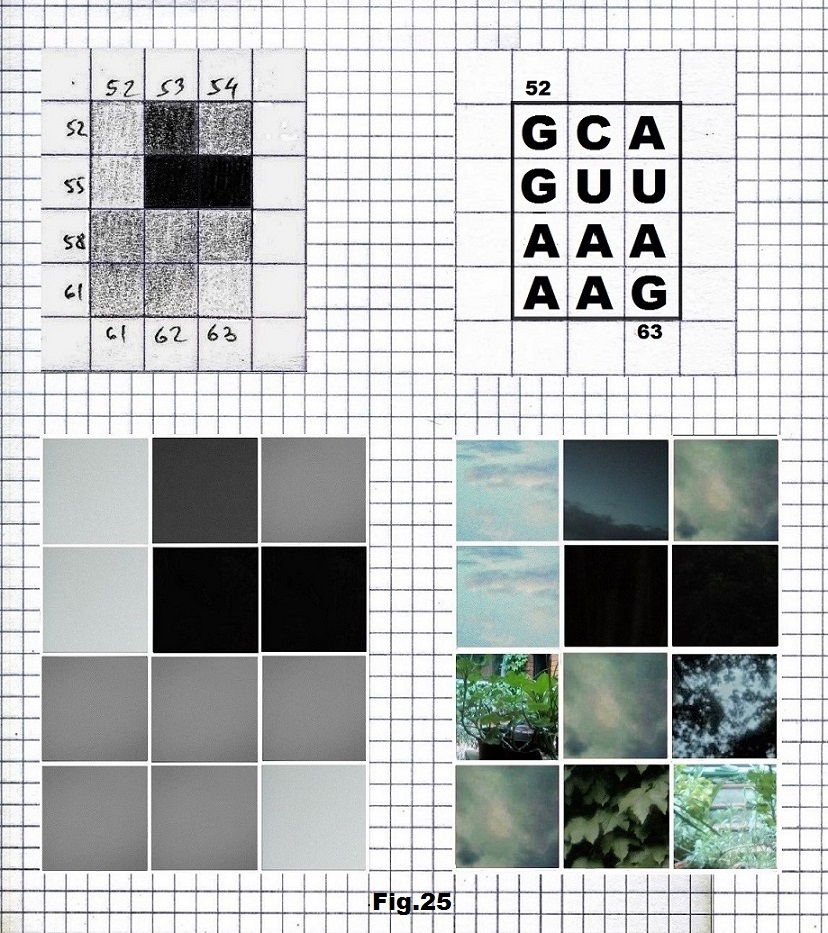
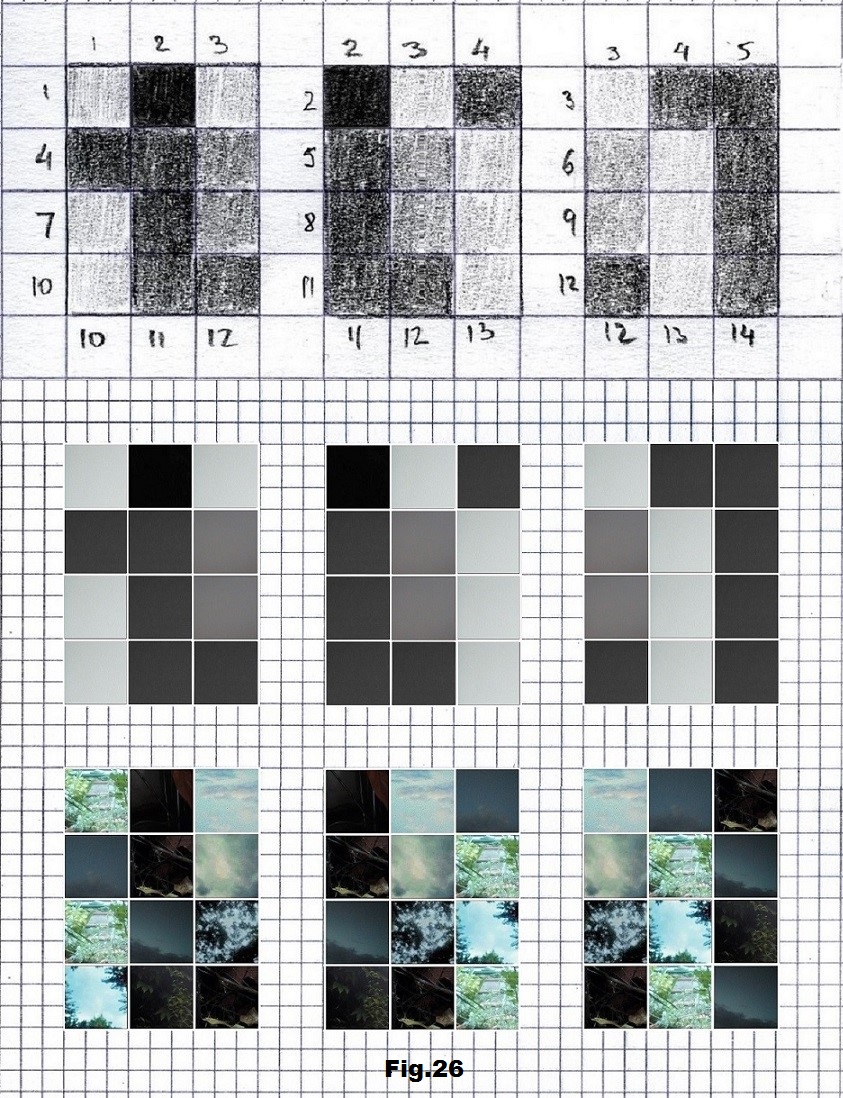
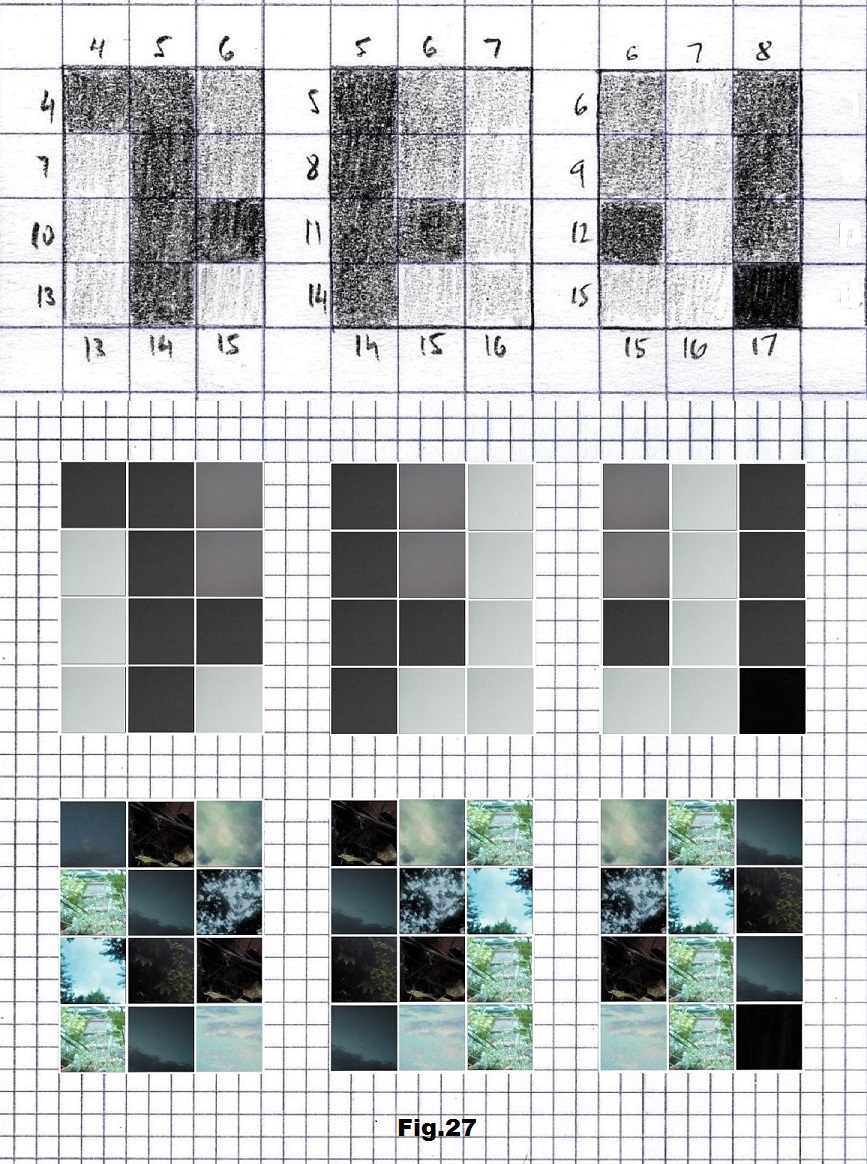
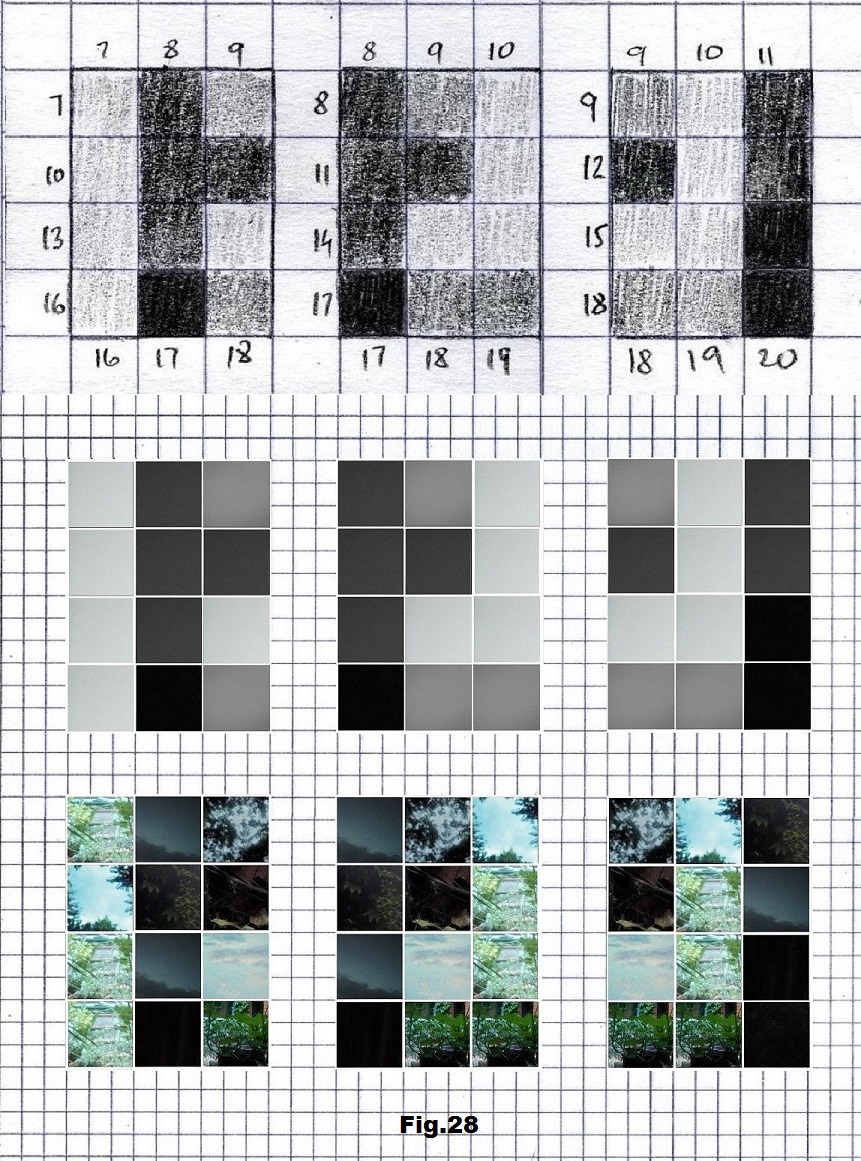
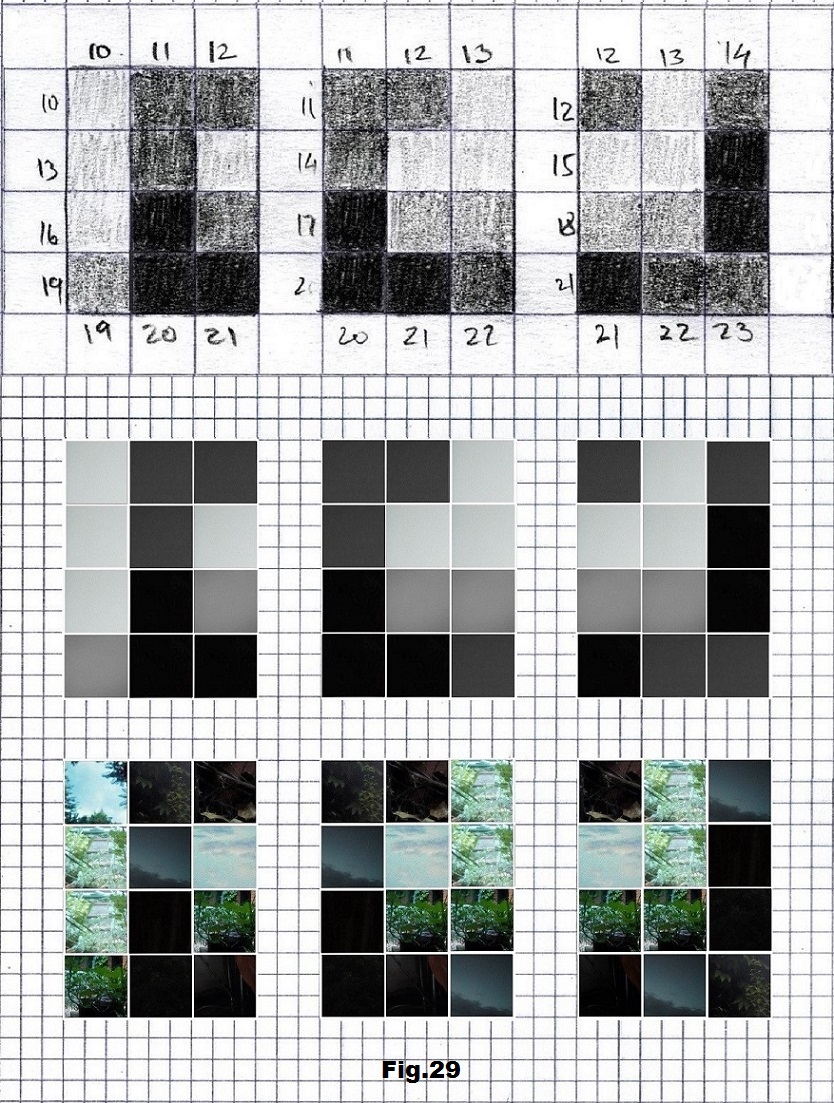
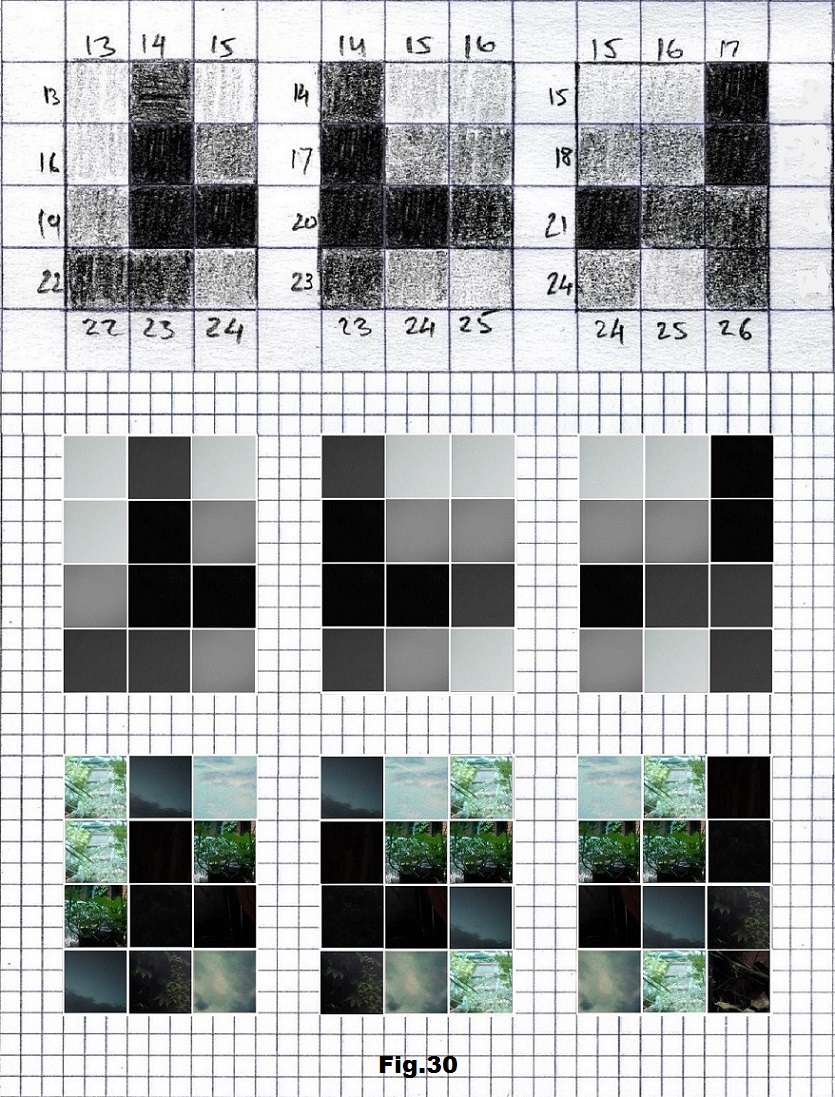
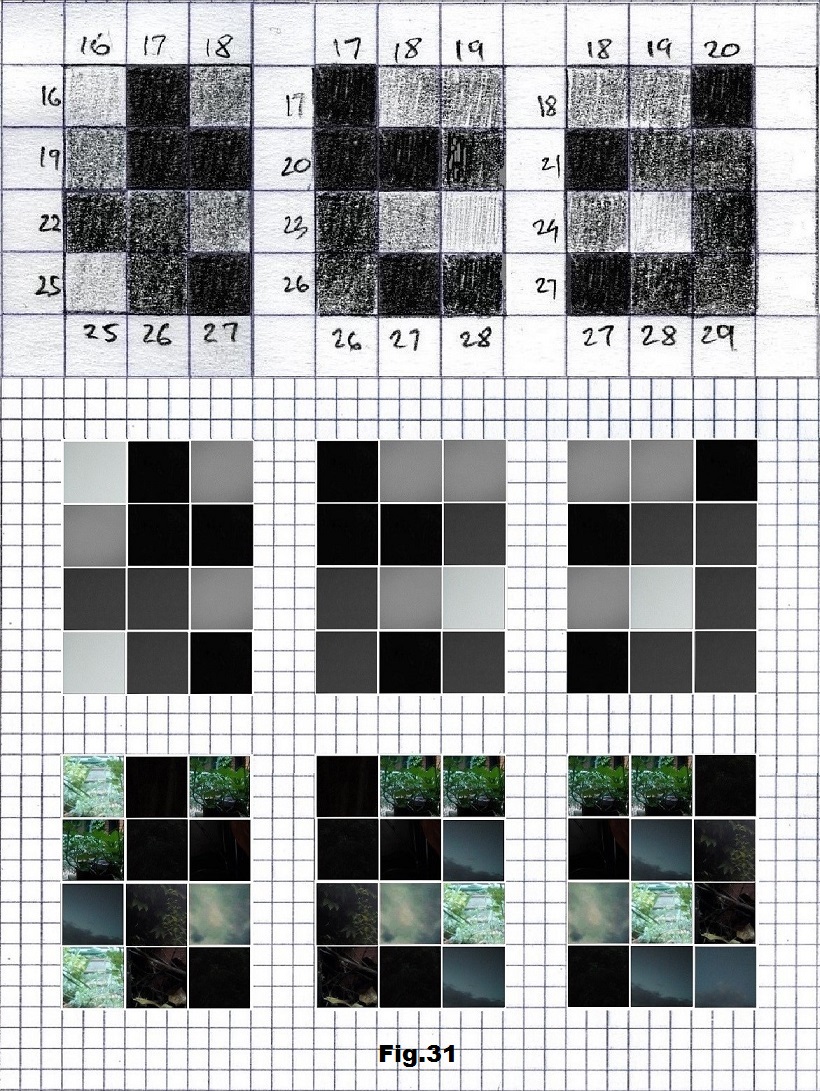
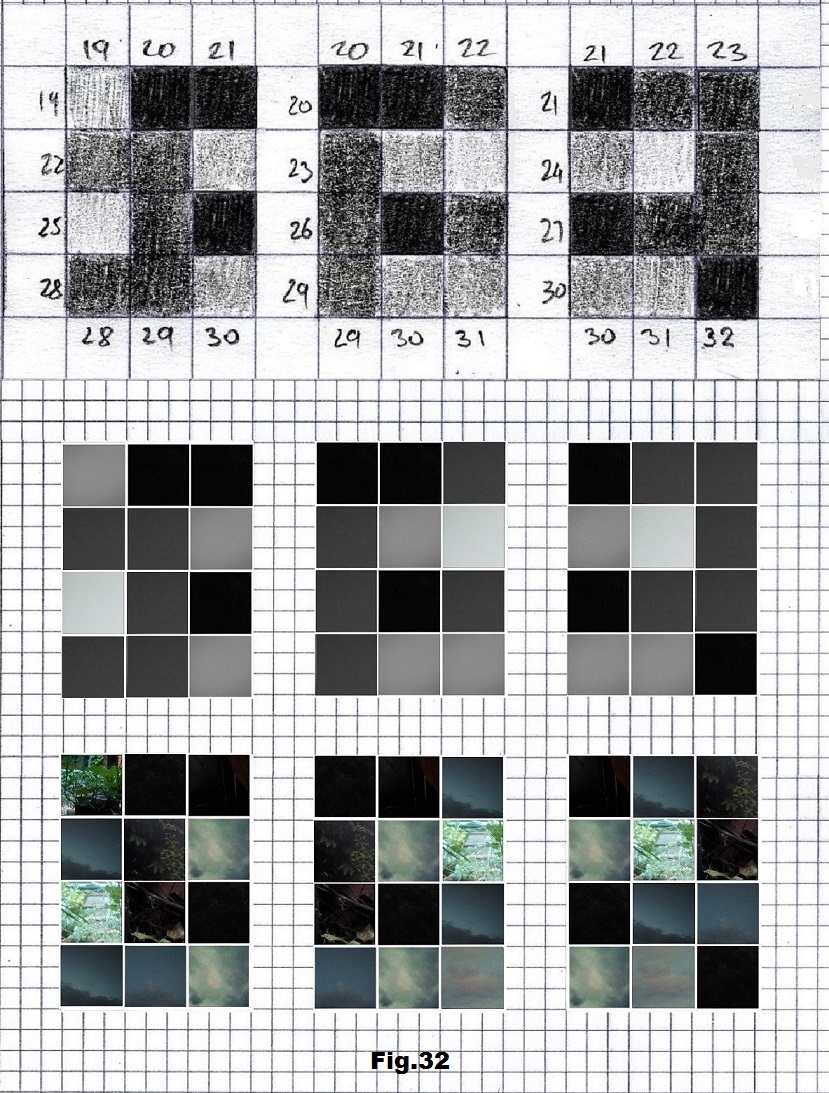
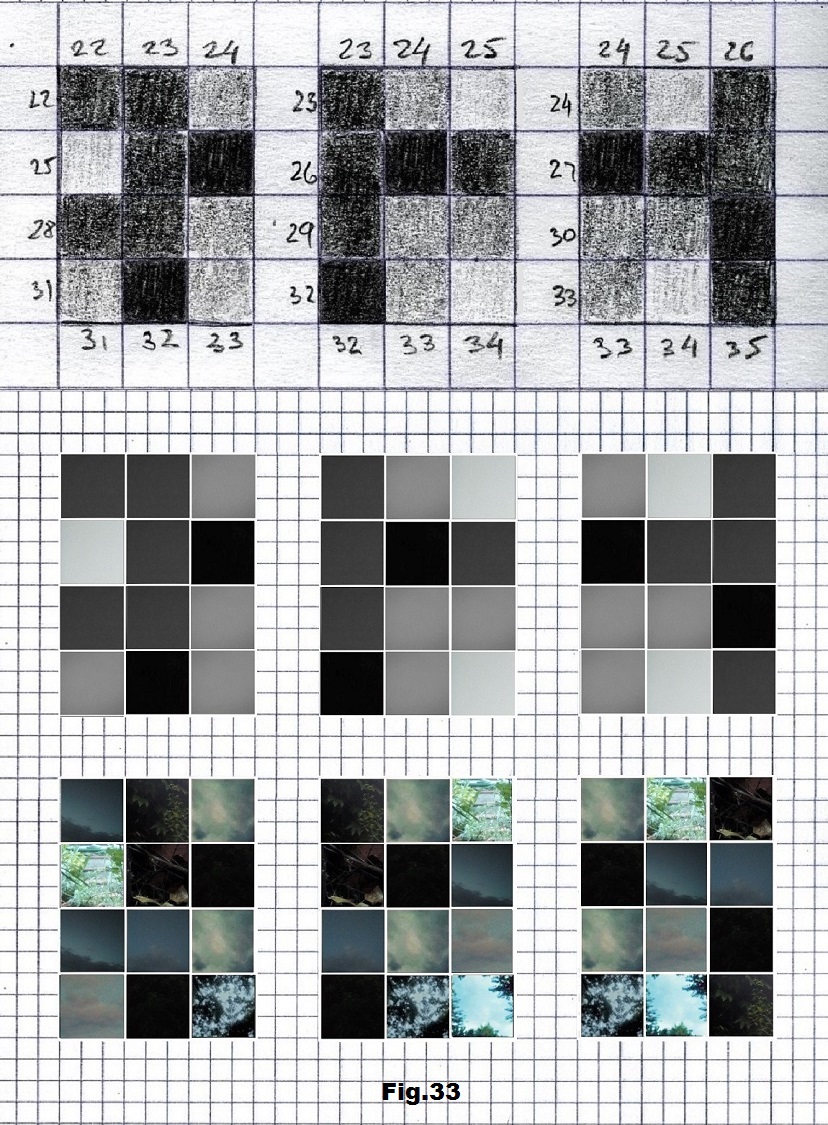
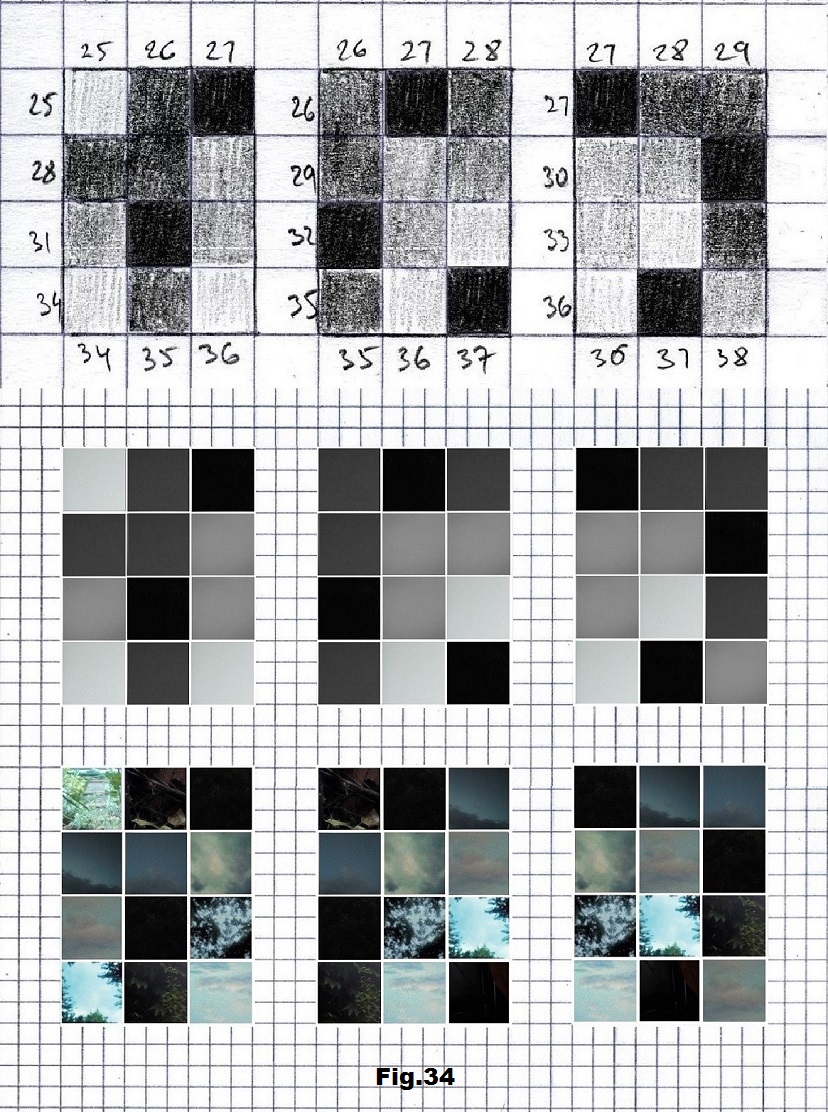
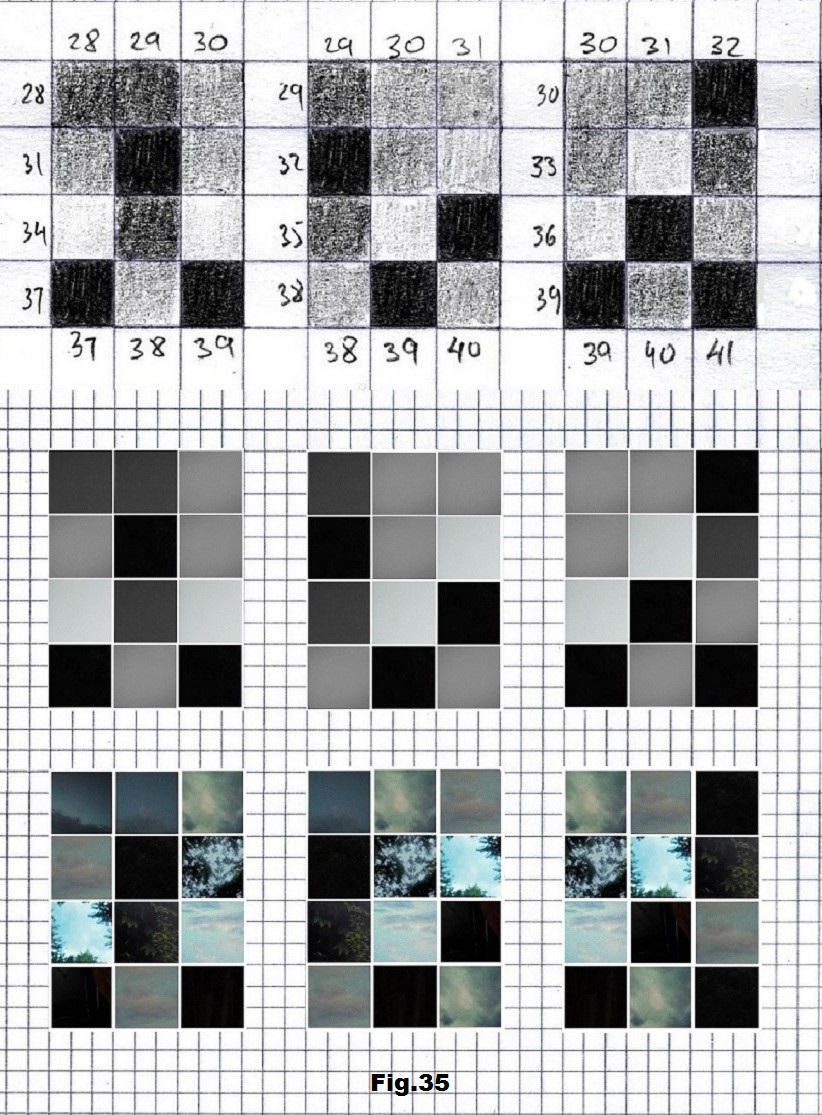
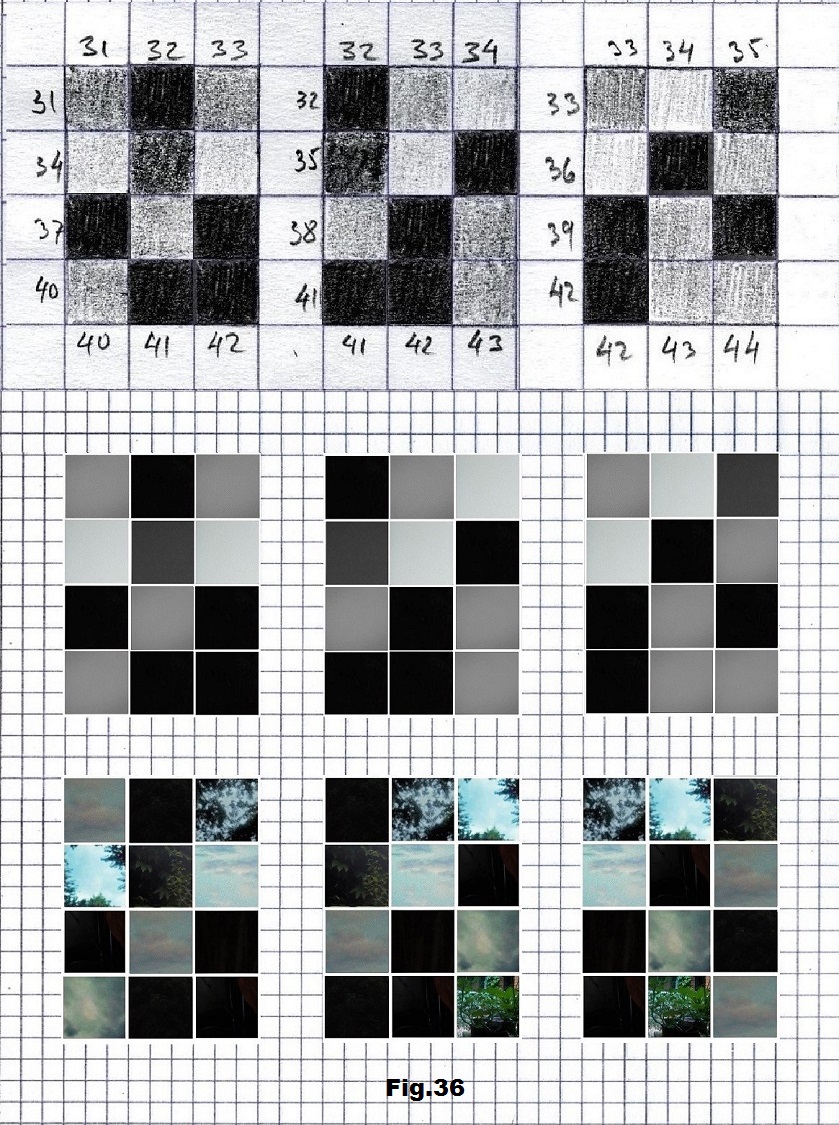
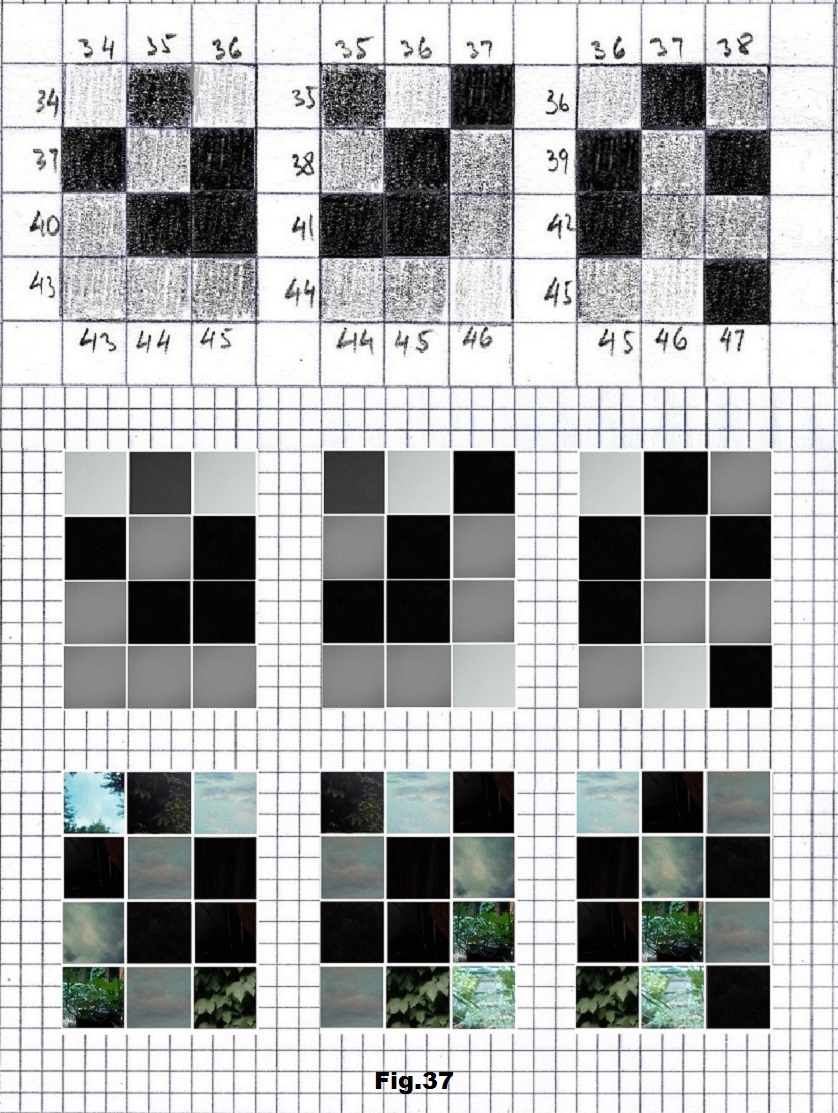
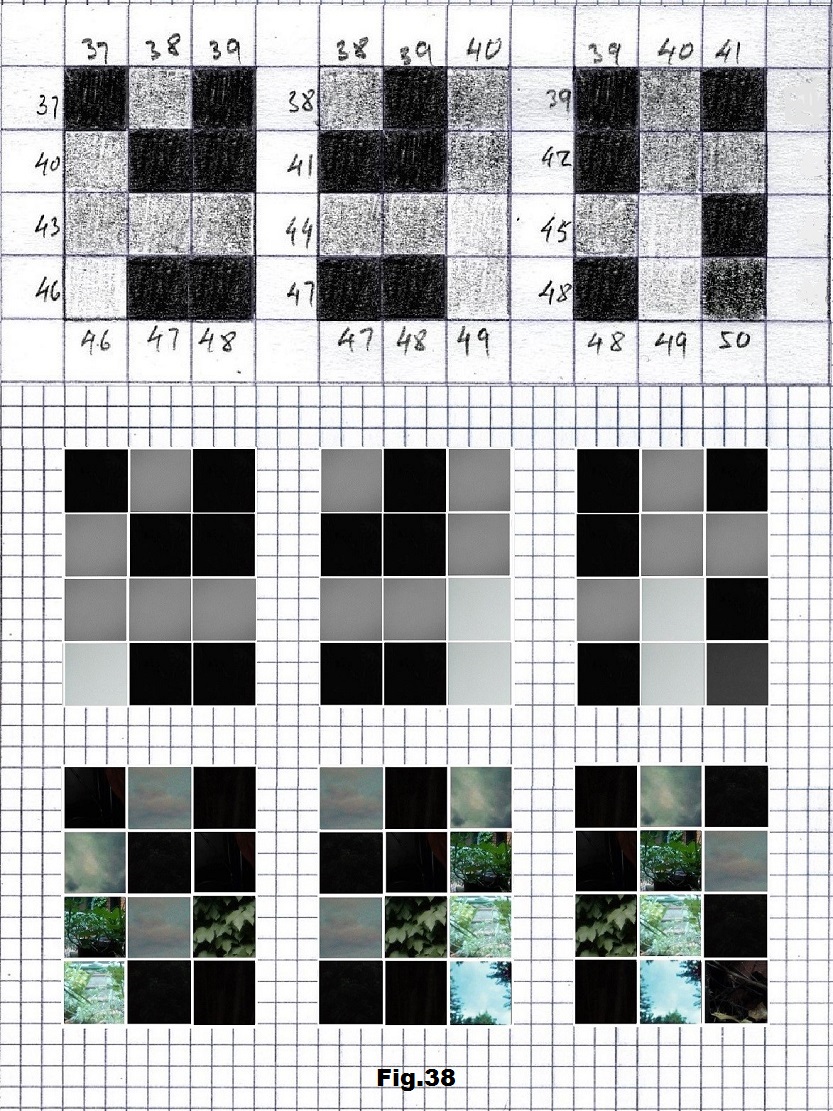
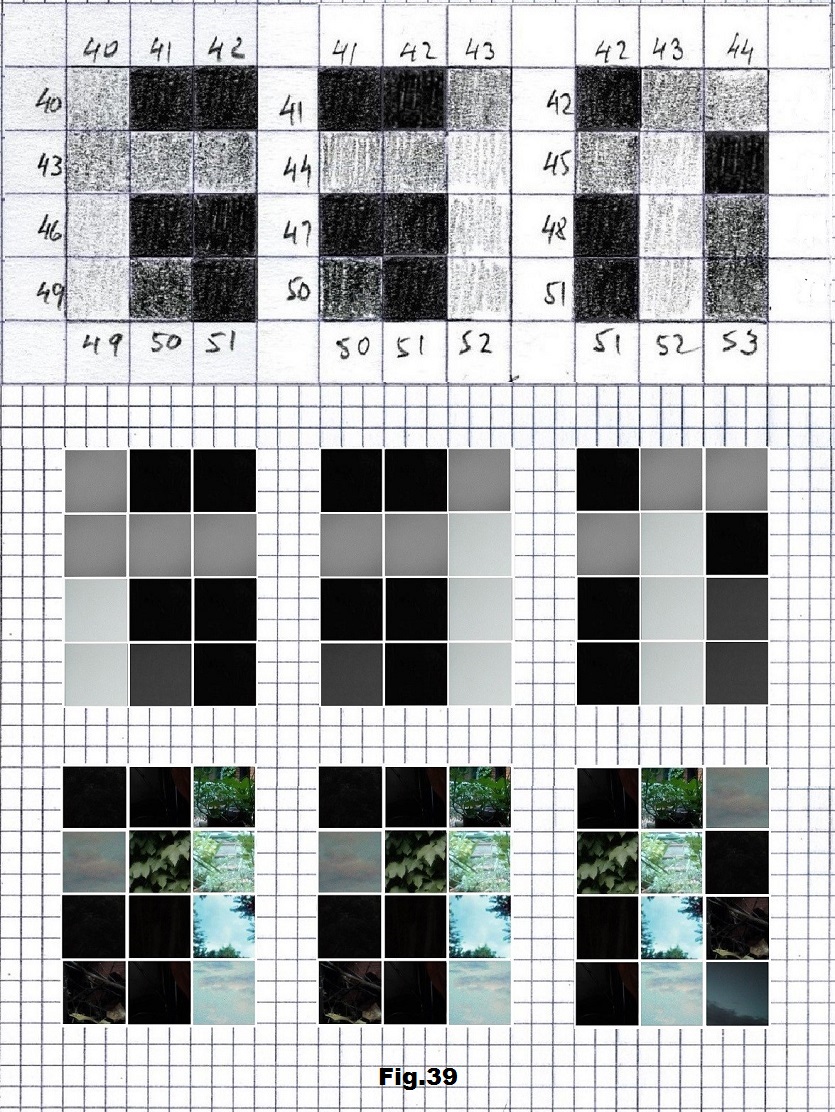
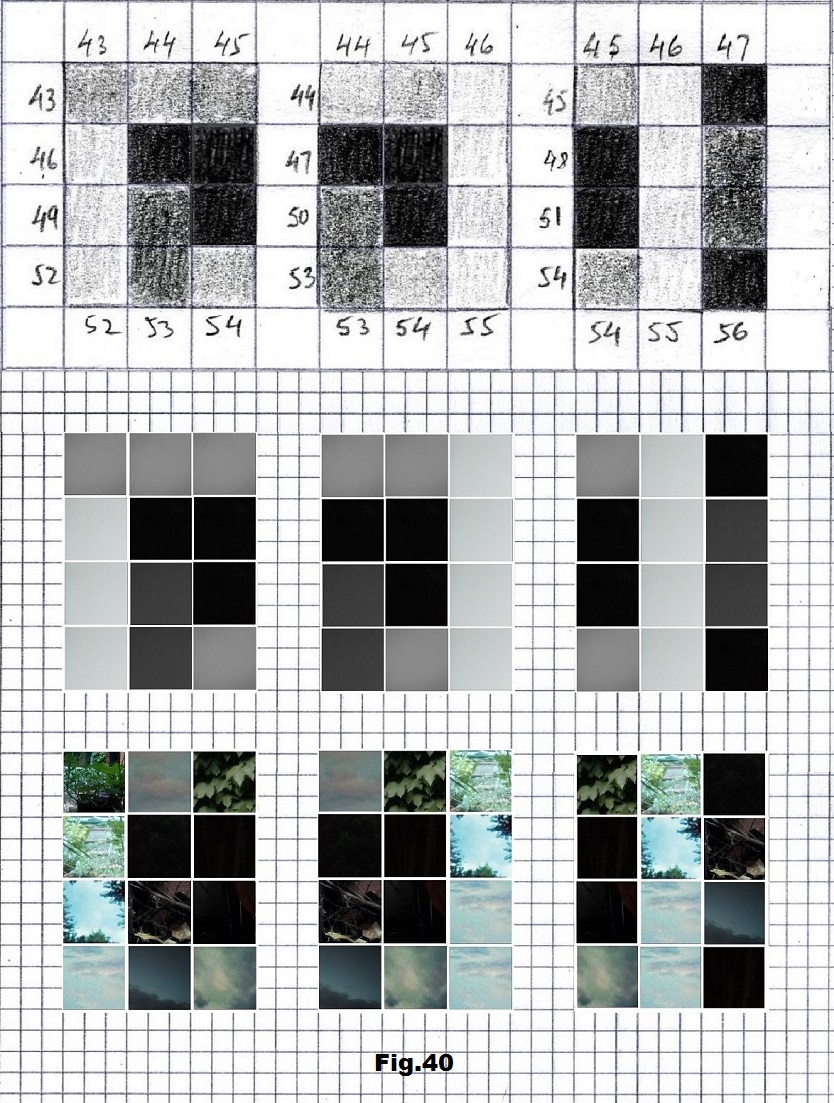
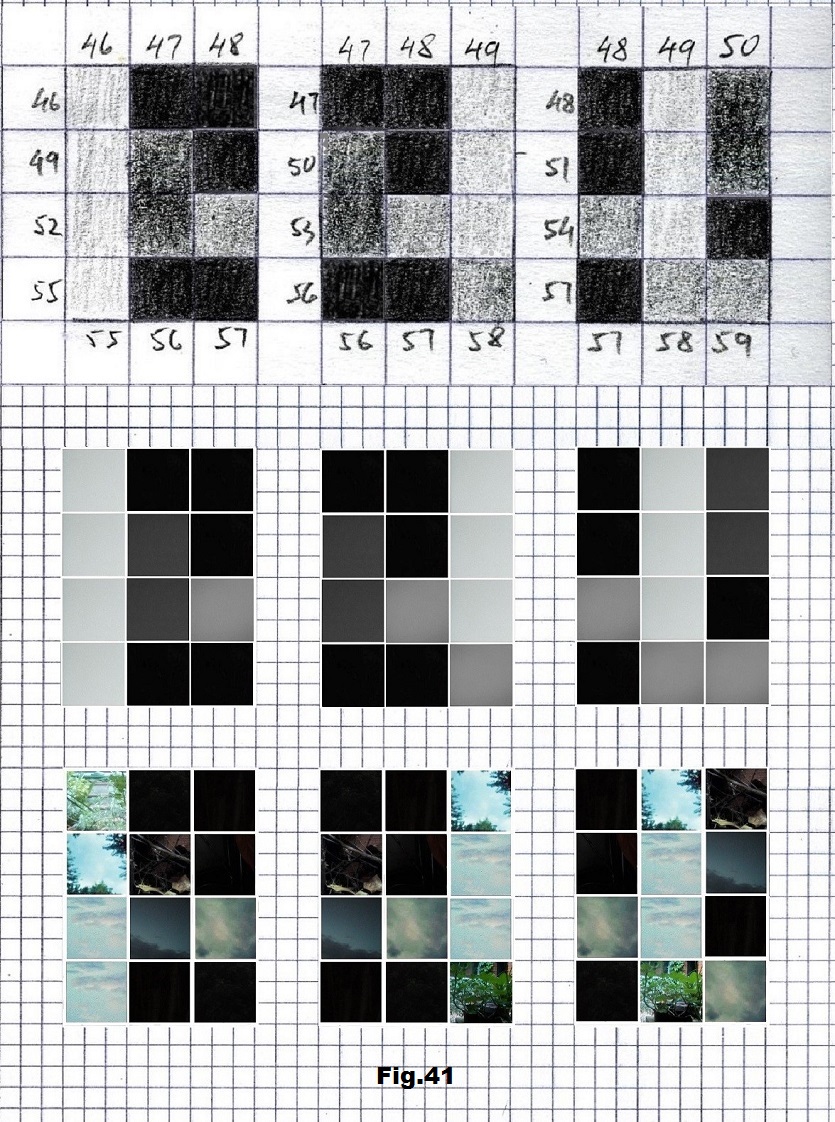
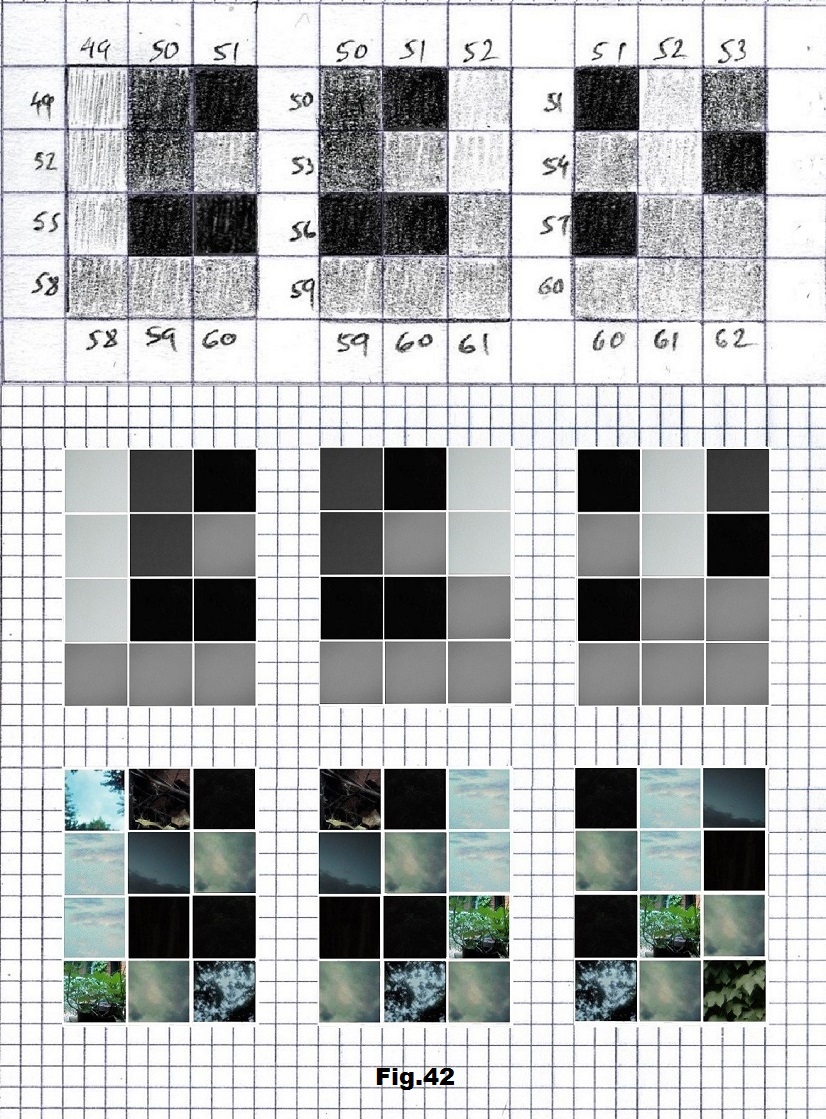
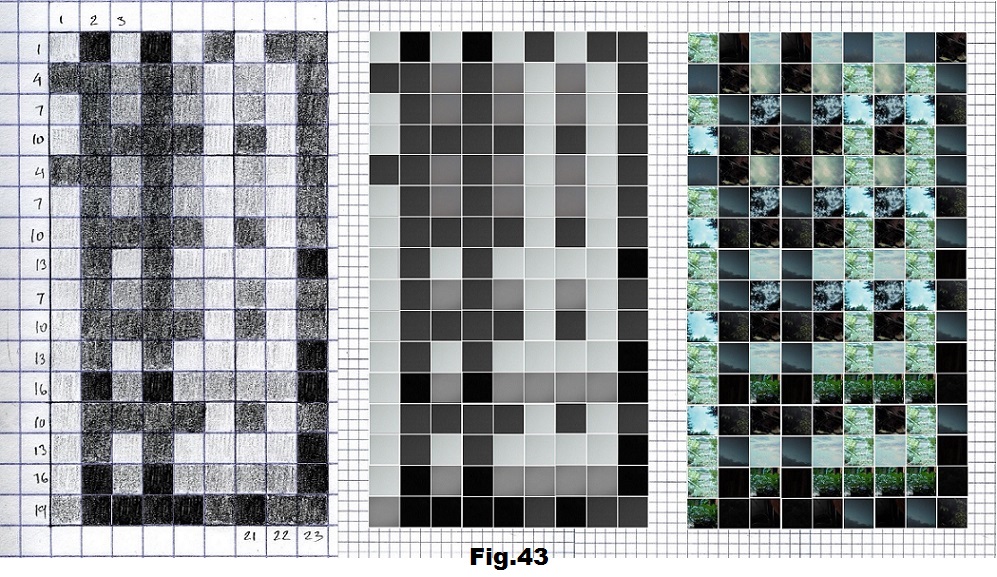
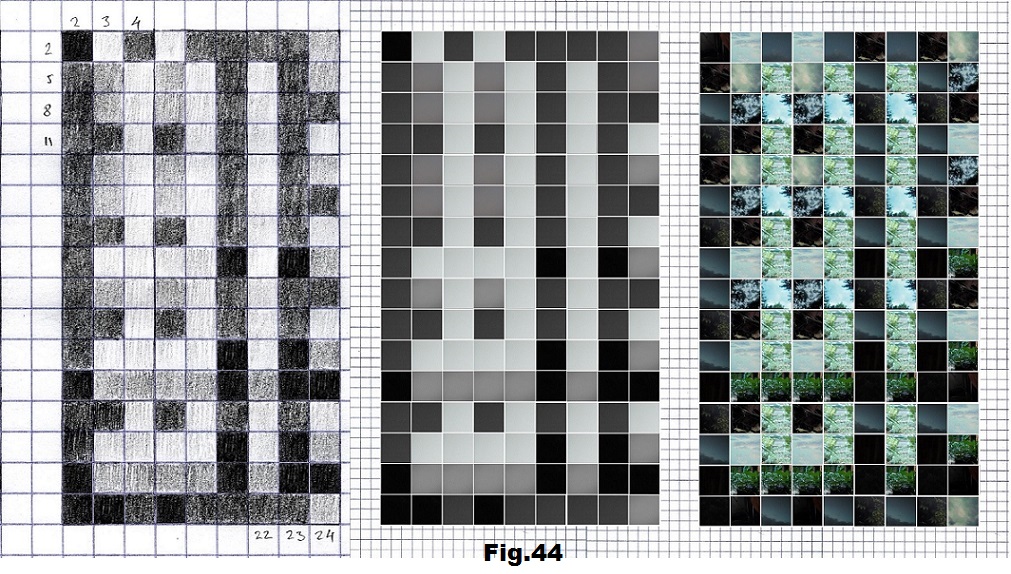
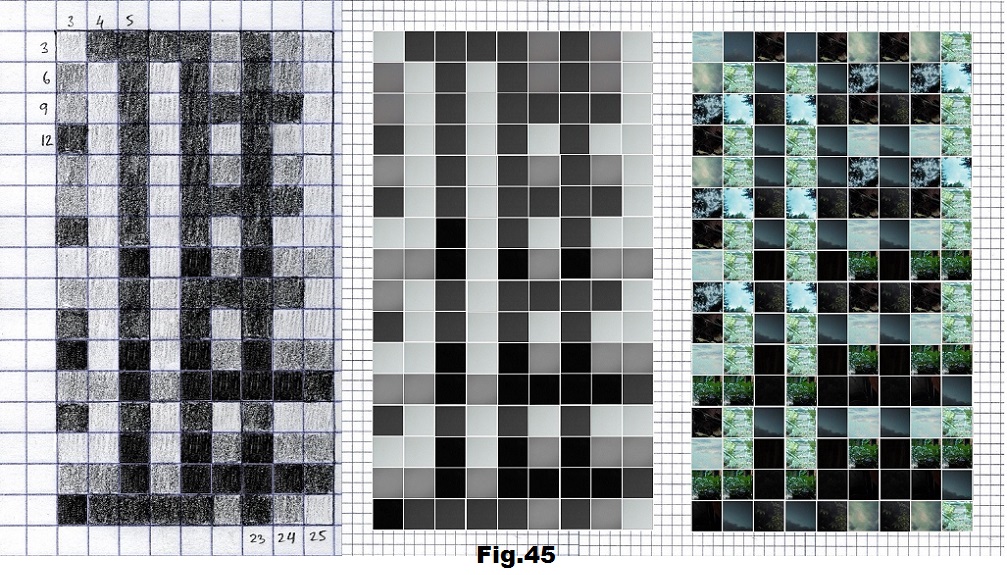
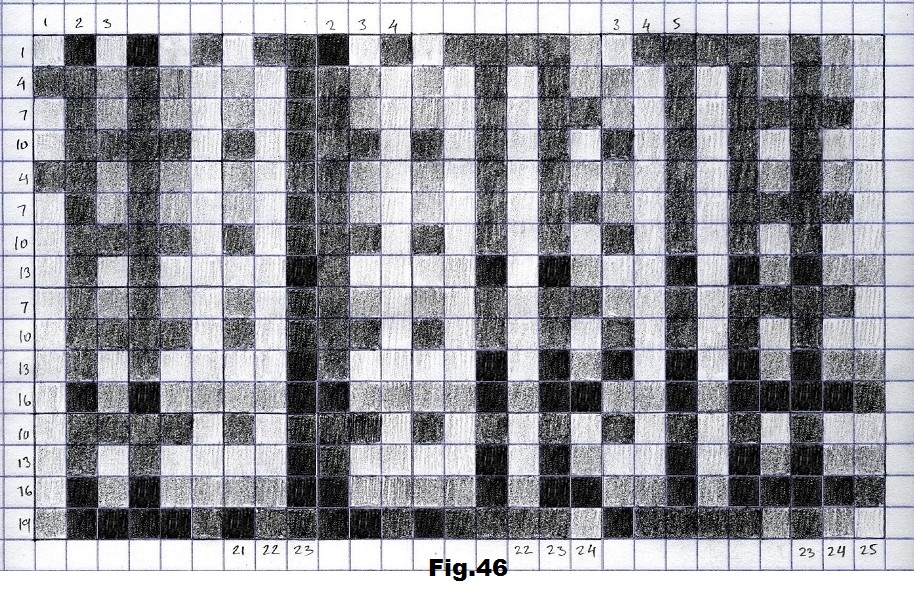
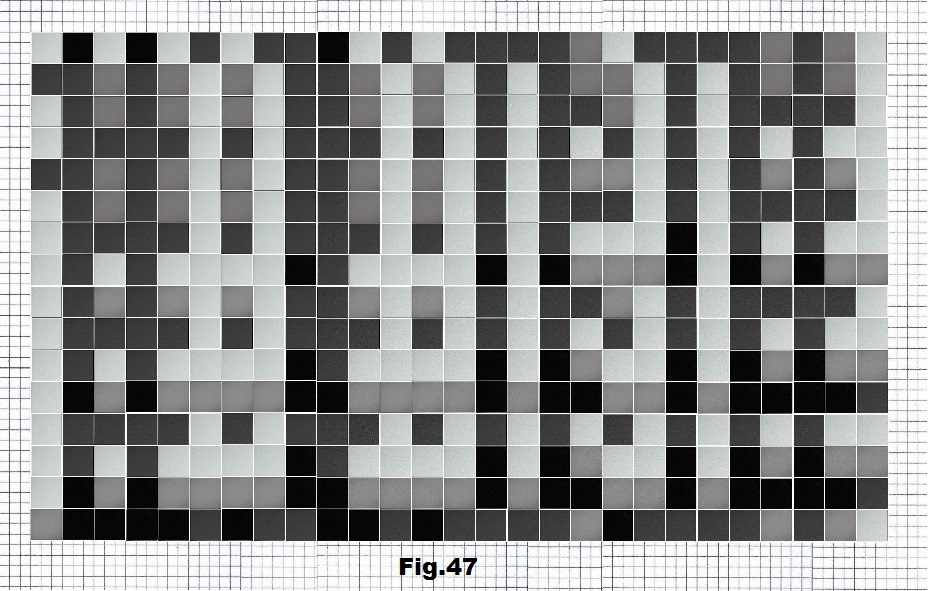
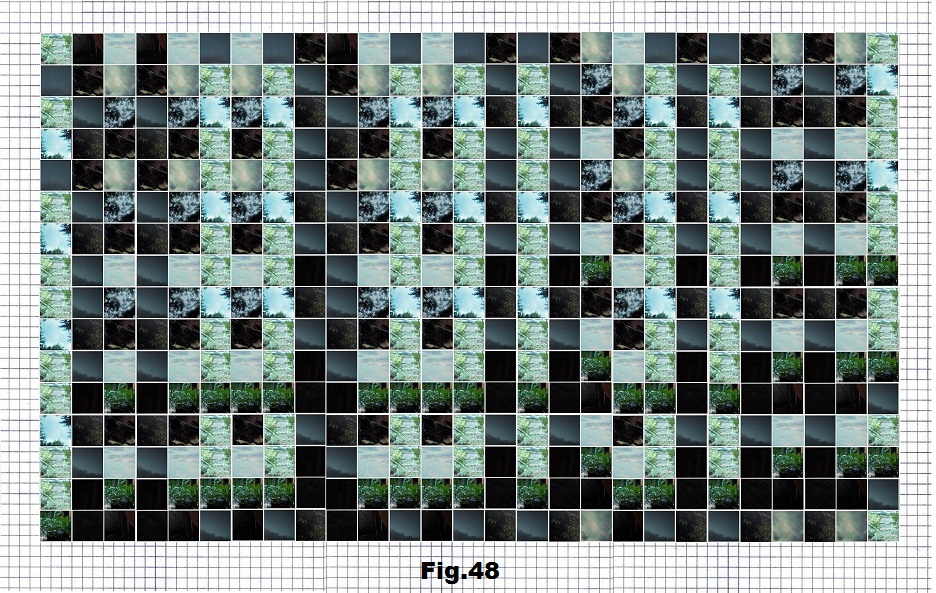
The next sequence selected to illustrate this idea is what seems to be the oldest known genetic sequence that could be found in all living organisms today. Some visual properties of this 63-base-long sequence in its DNA expression are analyzed in detail in another paper. Here it is introduced in its RNA version [fig. 23, 24] considering a possibility that the earliest living molecules could have been some early versions of RNA (proto-RNA). These images are not only an attempt to “see”/reconstruct the “views” of world (pencil drawings) the way they were recorded/impressed on this sequence at the time when this molecule was formed, but also to use it as a tool to “see” the contemporary world through the same “lenses” (camera pictures) like using a series of Muybridge’s cameras to record a street scene today. [fig. 25] The “pixels” representing the bases in these images are generated in three ways: as pencil drawings and as pictures taken with and without covering the camera lens. [fig. 26–48]
GUGCCAGCAGCCGCGGUAAUUCCAGCUCCAAUAGCGUAUAUUAAAGUUGCUGCAGUUAAAAAG
As indicated in the title, all this is just a rough approximation of how it might be possible today to get a glimpse of something that would echo the beginning of interaction of the first living molecules with their immediate environment (water). And that this interaction is recorded and passed to all living matter not only as our capacity to distinguish “hot” from “cold”, “light” from “dark”, but that these earliest “images” seems to be also encoded and preserved in our genes as well.
In all these cases the order in which the pictures were taken was predetermined; it was following the order of the bases in the RNA sequences. However, once when these kinds of “images”/“pixels” of our surroundings are recorded with the light-sensor randomly, in a reverse process we might be able to go back to RNA/DNA strands and try to identify the exact corresponding sequences.
- These are some thoughts about making a rudimentary “camera” or rather a sensor which will be able to pick-up and store light of a certain value/intensity. While moving this sensor between bright (sunny) and shadowy areas the intensity of recorded light would change from light to dark. Also, there has to be a timer, let’s say 1 sec (or 5 sec, 10 sec) that would end one recording instance and begin another. In our case it should be able to record one of five discrete values of the gray-scale at a time: white (0% black), light-gray (25% black), gray (50%) dark-gray (75%) and black (100%). However, since the intensity of light around us doesn’t have only these five discrete values but it is rather a of light values we have to decide which amounts will fill these five values. One possibility would be to define an interval as a single value. For example, if gray is defined as 50% black (between light-gray and dark-gray) then we will add 12.5% on both sides of this value and get an interval 37.5% – 62.5% that a sensor would pick up and categorize as “gray”. Similarly, amounts of light between 12.5% – 37% would be recorded as “light-gray” and the 62.5% – 87.5% interval would be “dark-gray”. And the interval from 12.5% to any higher intensity of light will be recorded as “white” while from 87.5% to any detected darker value will be recorded as “black”. These are “pragmatic” definitions of these five values of the gray-scale. Since, both DNA and RNA consist of four bases/values each, we have to decide how to define the border values in each these cases. In DNA the darker end is dark-gray, and the question is if we will keep its definition or extend its value to “black”. And in case of RNA it is the “light-gray” that is on the brighter end of the scale and the question is if it should stay as defined above or to be extended and include “white” as well. All this becomes more complicated considering first that DNA has two strands that reflect each other in a specific way. If a “positive” DNA sequence is TGAC (white, light-gray, gray, dark-gray) then its “negative would be ACTG (gray, dark-gray, white, light-gray) and this is called “replication”. Now, when the “messenger RNA” arrives to make a copy from a DNA sequence, the double-helix opens and the RNA makes a copy from the “negative” side of the strand ACTG that would be UGAC. Now, if we compare this RNA sequence with the “positive” side of the DNA, we would notice that they are the same except that instead of T (white) in DNA we have U (black) in RNA. Thus in this kind of two-step copying, from positive DNA strand to messenger RNA everything stays the same except that “white” is transformed into its negative – “black”, that is in itself quite interesting. It seems all this needs to be considered when deciding the border values in the four-value recordings, what would be the dark-gray in a series that corresponds to DNA and what would be light-gray in case of RNA; whether to remain as defined, or to be extended to “black” (and “white”). If we keep them as defined, we would in the case of DNA exclude recordings that come up as “black” and in the RNA case we would exclude “white”. Perhaps a sensor should have only one mode of operation, let’s say DNA as a positive strand, and store the recorded “pixels” (small squares) in a linear form. Thеn in the second step, convert this into a 2D image (3x4 “pixels”). From this recording we could get a negative DNA strand by using replication algorithm, and then the RNA as well. Starting with one set of four values, the other would be defined through DNA–DNA replication and DNA–RNA transcription. G (light-gray) and C (dark-gray) is the only base-pair with 50% value difference, and they also visually relate to each other as positive-negative. T and U also relate to each other as positive-negative but with a 100% value difference they do not form the base pair (value difference in all base pairs is 50%). In the case of two other base-pairs T–A and A–U bases do not relate to each other as positive-negative.